Environmental, Social and Governance
"De-carbonisation is central to the future of the heavy goods industry and our customers represent a significant proportion of the market. We look to be a supportive supplier to their net zero goals and are proud of the significant steps we have taken towards doing so."
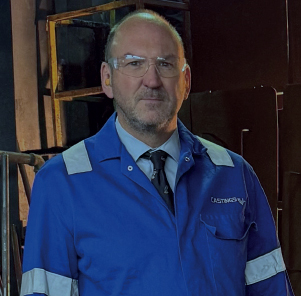
Adam Vicary
CEO
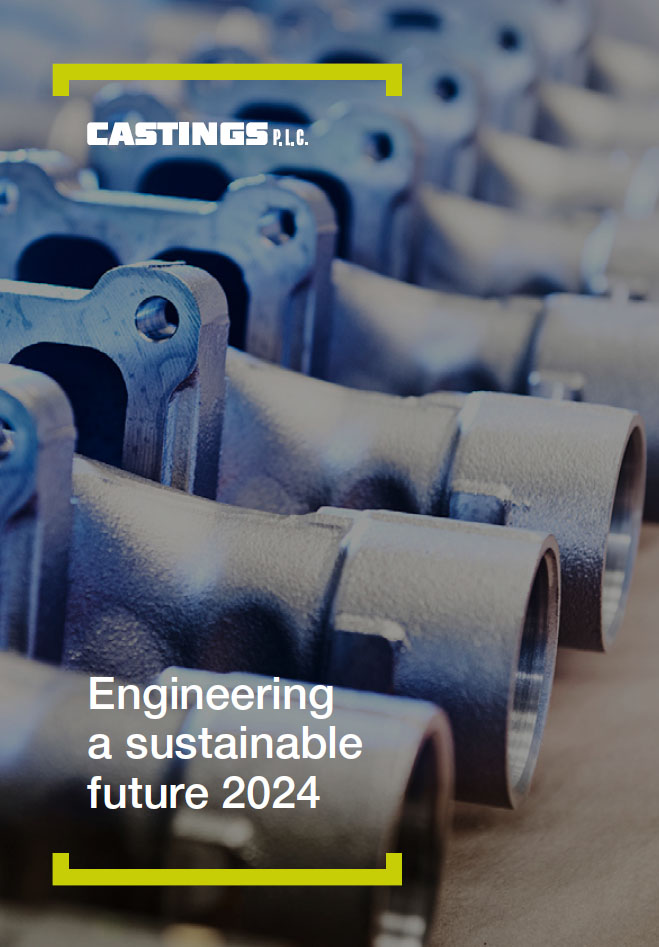
Engineering a sustainable future 2024
As CEO of Castings PLC, I’m proud to share the progress we’ve made this year, particularly in advancing our commitment to sustainability.
As a high energy user, we recognise the importance of moving forwards and developing our business to provide products that are very important to the transport industry we all rely upon, but in a manner which meets the net zero challenge and our stakeholders’ expectations.
Our electricity contracts became 100% certified renewable from October 2022 and in October 2023 we transitioned to a carbon offset gas contract.
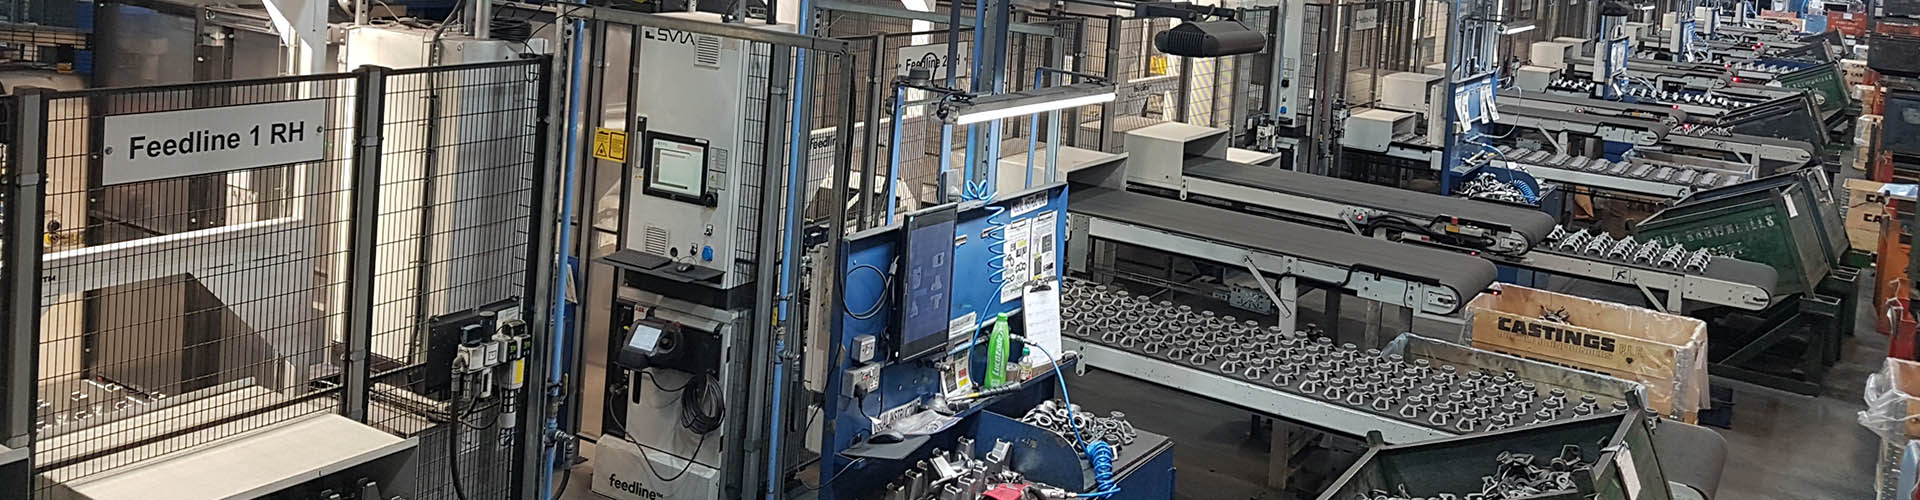
In combination with the use of electric induction furnaces and 100% recycled steel across our foundry operations this provides an excellent platform to supply our customers with a green iron product.
Our investments in green technologies have been transformative and with a number of exciting projects entering the production phase toward the end of the financial year we look forwards to continuing with the positive momentum generated.
It has been pleasing to see the installation of a centralised cooling plant complete at CNC Speedwell recently, a project part funded by the DESNZ Industrial Energy Transformation Fund.
In Spring 2024 we installed over 2,250 solar panels at CNC Speedwell, the group’s first on site renewables installation. Whilst challenges remain with regard to planning and grid connections constraints, we are actively assessing a number of further projects across all three of the group’s sites to increase on-site generation further.
Work is also beginning on a significant new foundry line at the William Lee site, with an acute focus on building a foundry for the future, using the most energy efficient plant and production techniques available.
I am confident that with our talented team and the support of our stakeholders, Castings PLC will continue to forge a path towards a more sustainable and prosperous future. Thank you to everyone who has been part of this journey and I look forwards to seeing our continued commitment to excellence and sustainability over the coming years.
Adam Vicary
CEO